Now Booking for Month, 20xx – Inquire Here

4 outdoor maths lessons for year 2

Year 2 - Statistics

Bring data to life with hands-on outdoor lessons where children collect, represent, and interpret information using tally charts, pictograms, and even human block diagrams. Through creative, active exploration with natural materials, pupils develop statistical understanding while connecting maths to the world around them.

Lesson Plans

Presenting data in tally charts

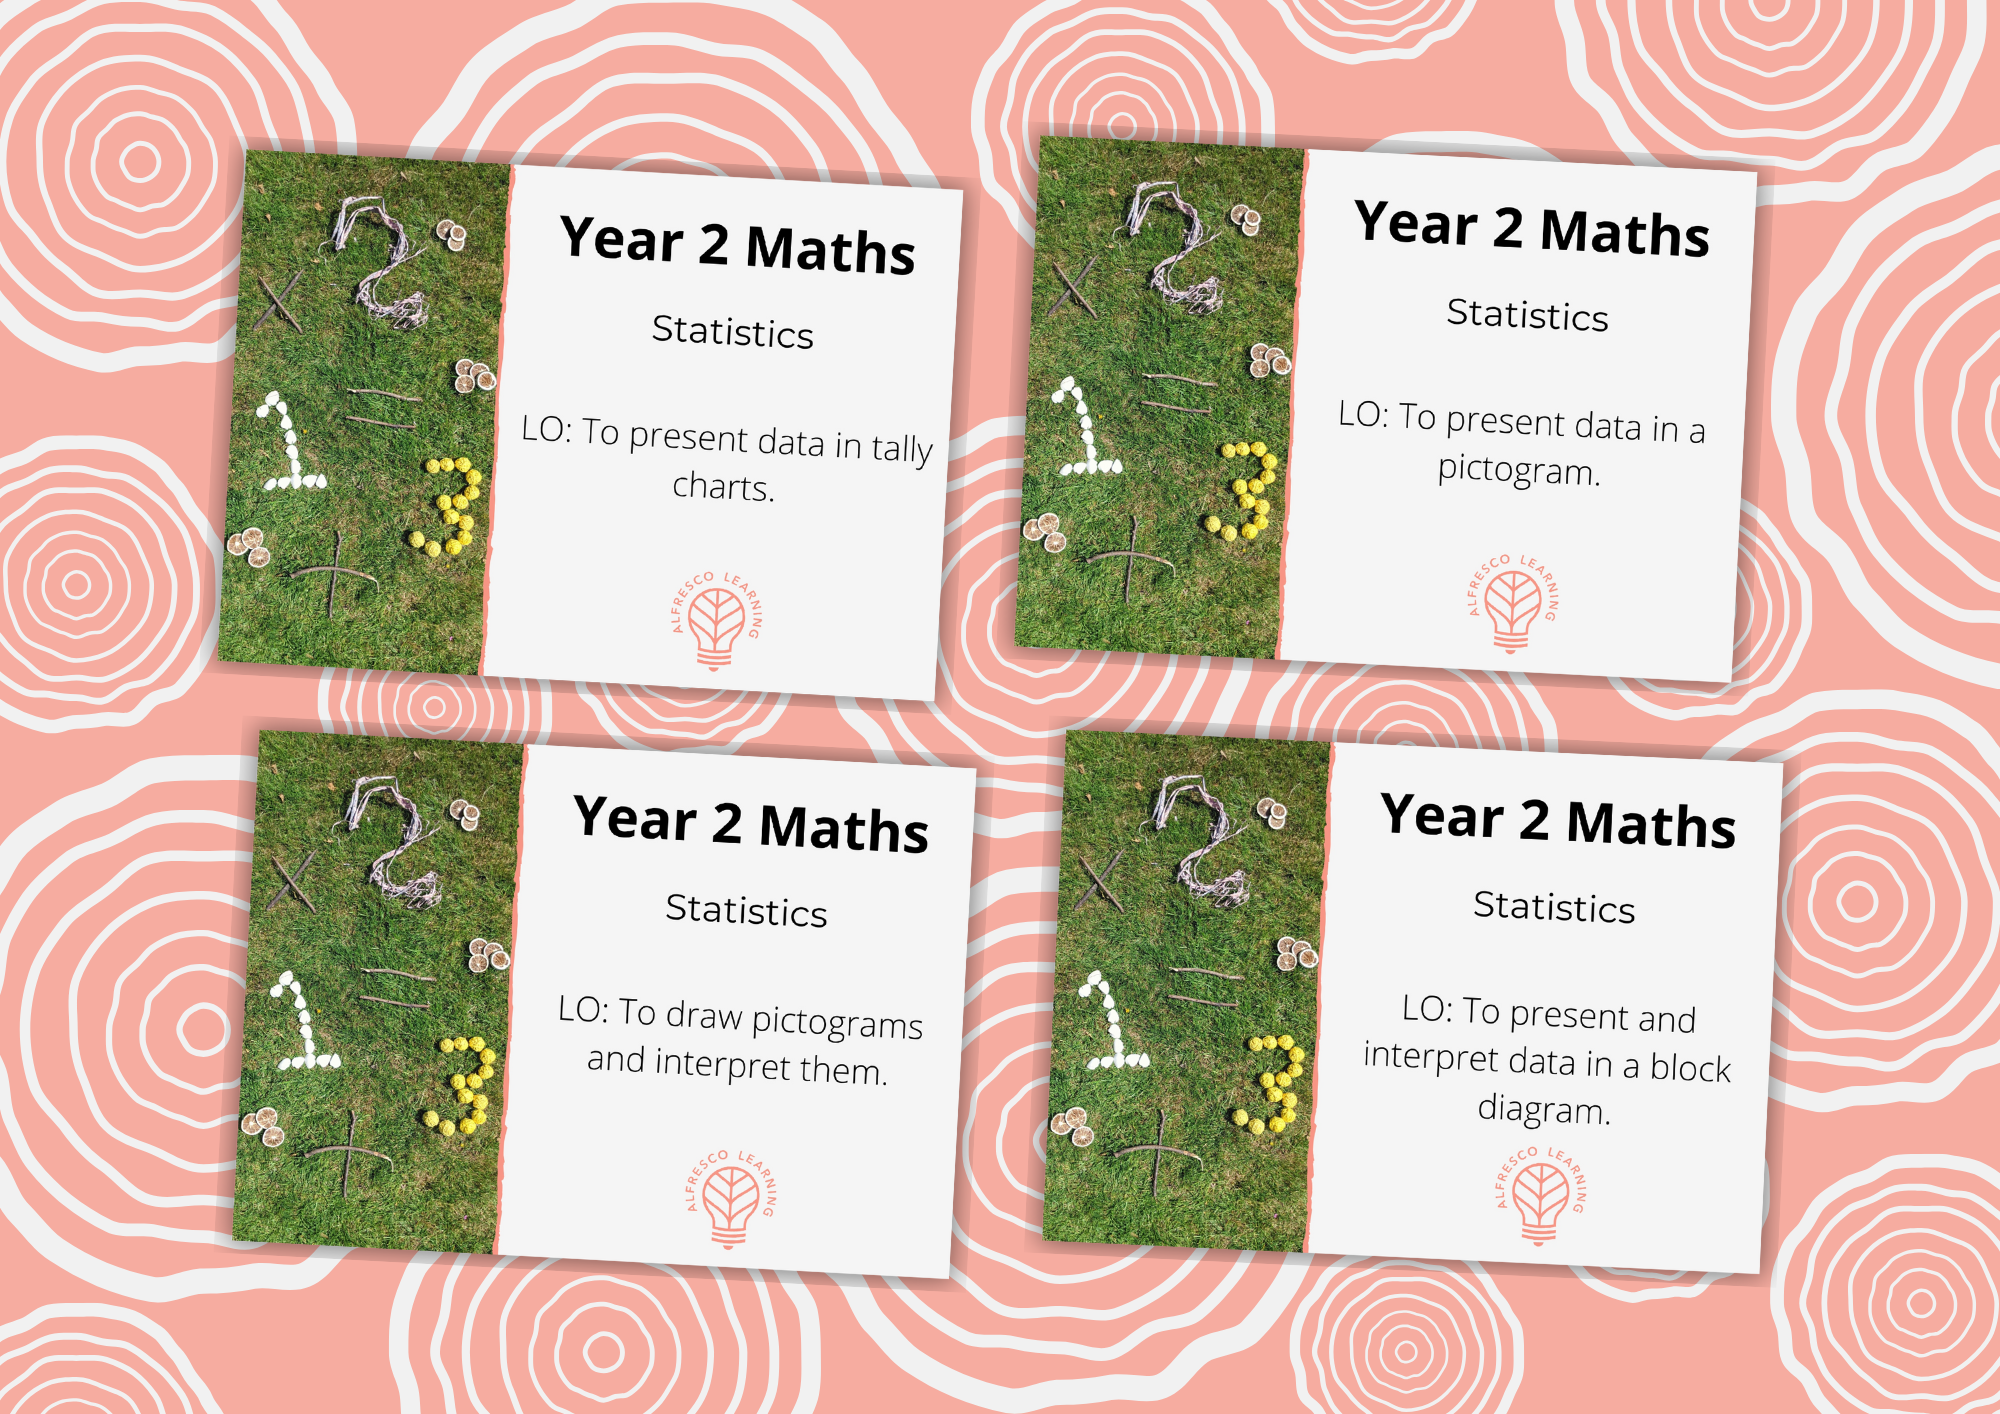
In this outdoor lesson, your children will use sticks to explore tally marks. They will have the opportunity to connect with your outdoor space, using a focus of your choice, and represent their findings in tally charts, while beginning to interpret data.

Learning objective:

To present data in tally charts.

Presenting data in a pictogram

The main activity of this outdoor lesson focuses on children representing data in pictograms using one-to-one correspondence. Using natural items to transfer data from tallies to pictograms, this lesson gives your children the opportunity to understand the data they’ve collected.

Learning objective:

To present data in a pictogram.

Interpreting pictograms

Develop your children’s understanding of pictograms by extending them to explore the use of many-to-one correspondence. This outdoor lesson encourages children to use their existing maths knowledge in combination with their statistical understanding to create large-scale pictograms and interpret them.

Learning objective:

To draw pictograms and interpret them.

Presenting and interpreting data in block diagrams

Introduce children to the concept of block diagrams by creating their own human version outdoors! Children will then move onto creating their own data sets and asking their own questions about data in this creative and fun outdoor lesson!

Learning objective:

To present and interpret data in a block diagram.

Before you get started

Safety and sustainability is super important!